The term big data is loosely defined as extremely large set of data that may be computationally analysed to reveal trends, associations and patterns especially when it comes to human interactions and behaviour.
This is just one of many definitions of big data. This is because the definition is still fluid and concept of big data is continually evolving.
Data itself isn’t a new concept. Even before computers and databases we had paper records: customer records, bank transaction records and so on. All of which are still data.
The emergence of computers, spreadsheets and then databases gave the possibility to store and organise this data more efficiently and on much larger scale.
Before we dive in big data let’t get familiar with basic definitions of data, information and knowledge.
Data can be words, dates, sounds, images, numbers and so on without its context. Data is a raw form and without context does not hold much value.
Information is a collection of data that is put into context that gives the data a meaning. It is data that has been processed and is organised.
Knowledge comes from understanding information, ability make predictions, form judgements and opinions based on understanding of that information.
Some also define big data with three or even five Vs. Those being:
- Volume – The size of the data
- Velocity – Defines the speed at which new data is generated, and the speed at which new data moves around
- Variety – Defines that data is of many different types
- Veracity – Refers to quality of data, its accuracy
- Value – Big data by itself has no value. Value refers to the ability to turn data into value. According to IBM Big Data & Analytics Hub:
“It is easy to fall into the buzz trap and embark on big data initiatives without a clear understanding of the business value it will bring.” (Marr, 2015)
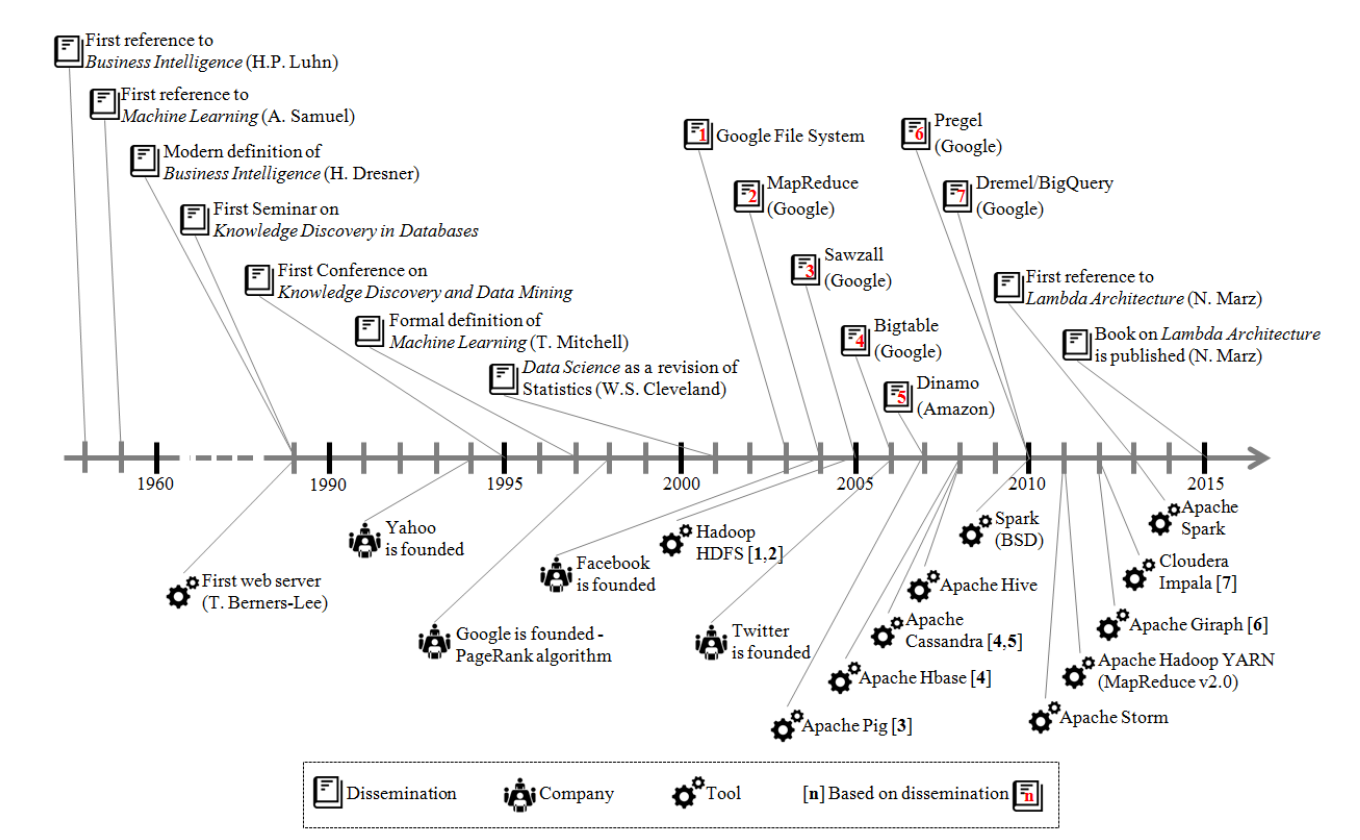
Historical development of big data – technologies and techniques
To talk about historical development of big data it will be easier to explain it in context of a business institutions and the term Business Intelligence that first references dated back to 1958 by Hans Peter Luhn an IBM researcher in IBM Journal of Research and Development “A Business Intelligence System” published in October 1958.
Later in the timeline with the progress of computerisation of business processes the definition of the term have then evolved in the 80’s decade and became more established in terms of defining set of software systems that would aid business decision making process based of gathering and analysing data (facts).
Those systems were that mainly focused on descriptive analysis that would take aggregated historical data and cross-match indicators to acquire better view of what has happened and is happening in the organisation.
Because data was mainly used for analysis of which the outcome produced some sort of value to the business (mostly in form of intelligence that could be acted on) at the end of the 80’s a Data Mining term have emerged. The term was used interchangeably with another trem called Knowledge Discovery in Databases (KDD) and meant extraction of data from data banks to form knowledge. This term have led the first international conference on Knowledge Discovery and Data Mining in 1995.
While businesses previously focused on descriptive analysis of data this is were predictive analysis began to spread among businesses during the 90’s decade using machine learning techniques.
Those techniques were utilised to search for patterns in data. This type of analysis were first mostly applied and used in banking and insurance industry. Early examples of that were detection of insurance fraud or process od approving or denial of credit applications.
The concept of Data Science has emerged from those king of mining applications. This term emerged in early 2000 and wal closely related to the field of statistics (Cleveland WS, 2001).
With data mining and popularisation of the World Wide Web companies started to face the problem of the dimensions of data.
It is worth to note that while early examples of storing and processing data (mainly focusing on descriptive analysis) could be stored and processed using capabilities of conventional approach (including relational databases), due to big data volume, velocity and variety it became unfeasible. It was the 3Vs model that began being a key aspect in strategies for optimal management of data within a business context.
Google has faced this problem initially when trying to solver PageRank algorithm efficiency problem when applying large volumes of data coming from the mining of the websites (Page L, Brin S, Motwani R, 1998)
Instead of using high performance machines with large amounts of processing power they came with another solution. They divided the large volumes of data to be processed among set of distributed file system using high performance computers.
The software and the programming model was named MapReduce and was a significant milestone that refers to origin of big data technologies (Dean J, Ghemawat S, 2004)
” Thanks to the use of this model, the work to be done by an application programmer is reduced to defining the details of two functions (“map” and “reduce”), which represent the two main steps in the processing of data.” (Niño, Mikel & Illarramendi, Arantza, 2015)
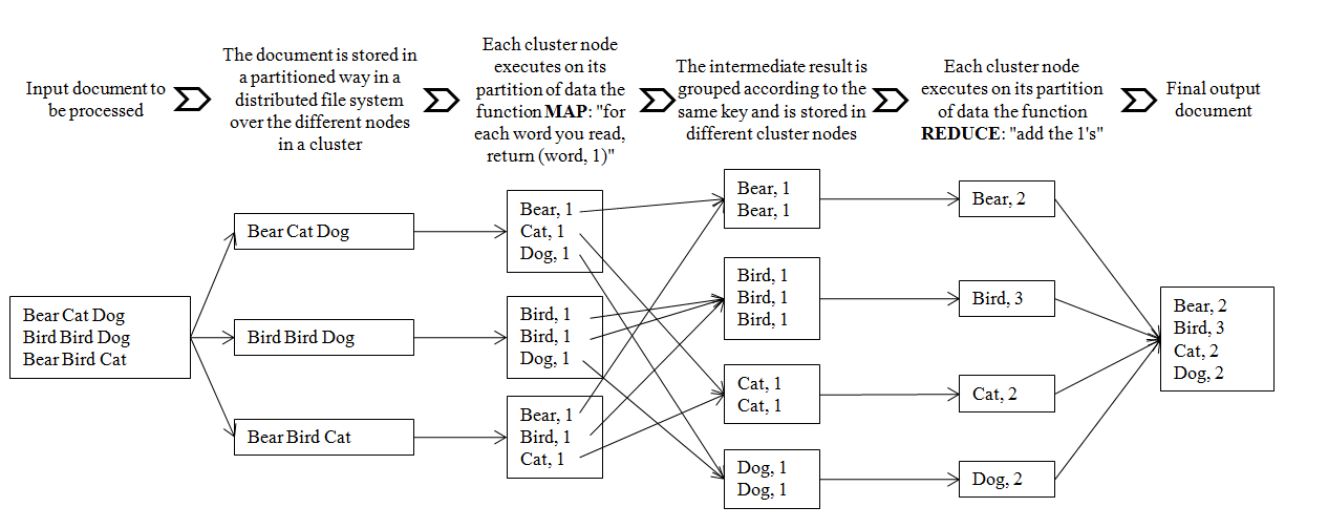
(Niño, Mikel & Illarramendi, Arantza, 2015)
This project served as grounds for Doug Cutting developed while working for Yahoo. He was building a system that implemented MapReduce. A system capable of processing enormous amounts of data required by the search engine. This is how Apache Hadoop was born.
Apache Hadoop being an open-source facilitated adoption of big data technologies.
At this point starting in 2005 with Google Sawzall (a language to program tasks when analysing big data structures on MapReduce other technologies were build including Apache Pig, Apache Hive, and the emergence of many NoSQL systems.
(Niño, Mikel & Illarramendi, Arantza, 2015)
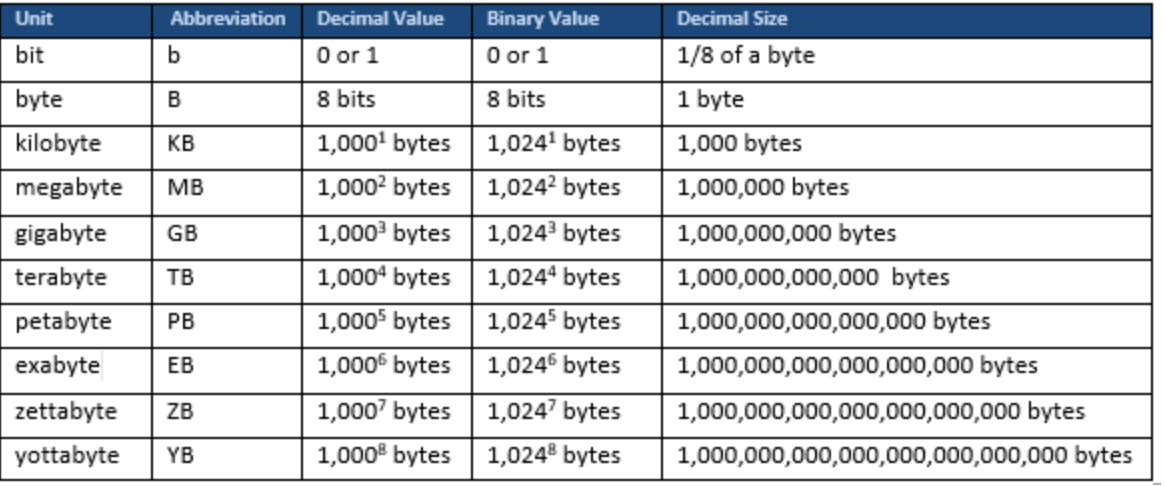
Below is a table showing measurement of data:
With ever increasing storage and processing capabilities the rate at which data is created in modern society is enormous. Data created over two days is as much data as was created from beginning of time until 2003.
“Global mobile data traffic grew 63 percent in 2016. Global mobile data traffic reached 7.2 exabytes per month at the end of 2016, up from 4.4 exabytes per month at the end of 2015. ” (Cisco)
It is also claimed that about 90% of data in the world was created in the las two years.
Image below shows data growth over time:
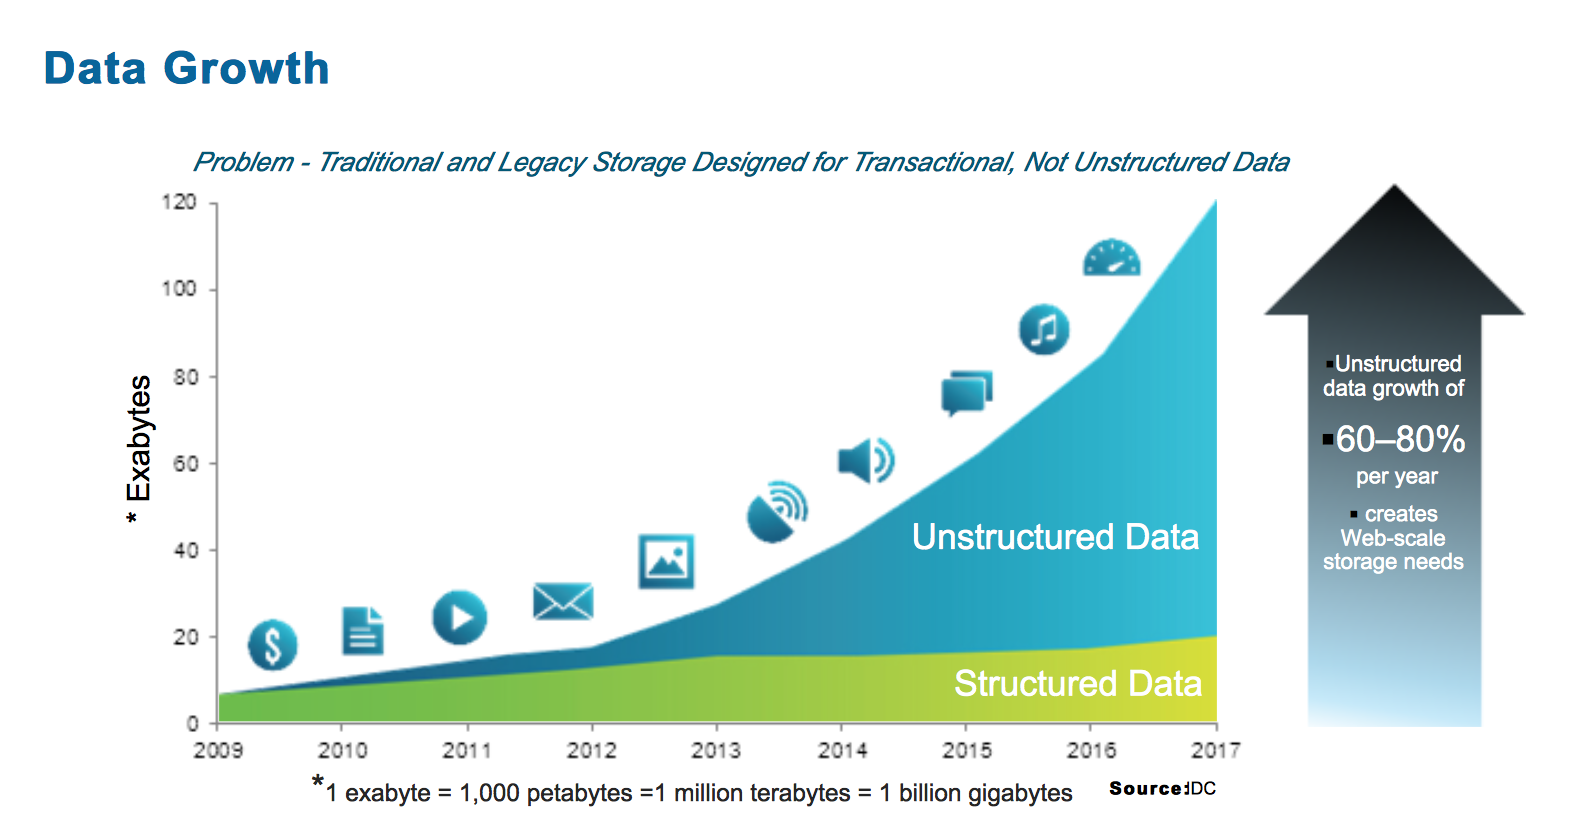
“The basic reason for such growth is that more people have more tools to create and share information than ever before therefore creating and generating new data. In the past data ( or information) was created by few companies and everyone else were the consumers of data and information. Nowadays all of us generate data on daily basis but also all of us consume data.
From a technical perspective to add to the tools that we have that enable us to create or generate data the costs of those tools as well as to store and process data are no longer prohibitive.
Going back to traditional data analysis we can point out few limitations of this approach.
As previously mentioned the large size of modern data is a limitation itself. It is not fesible to sore such large volumes of data in traditional relational database systems.
Another limitation is that most of the data created comes in semi-structured or unstructured form which relational databases are not suited for.
Velocity of modern data also created a problem for traditional
RDBMS which lacks in high velocity because it’s designed for steady data retention rather than rapid growth. It would be very expensive to handle and store “big data” in RDBMS.
While previous examples have mentions a little about some of the limitations of traditional data analysis in relation to modern data, in order to further expand on the topic we first need to dive in into basic definitions of traditional statistics such as descriptive and inferential statistics.
Descriptive statistics involve computing values which summarize and describe
a set of data , to tell about the features of data. Typically this includes statistics like mean, median, min, standard deviation, max, and so on, which are called summary statistics.
Inferential Statistics involve scientists to perform complex mathematical calculations. Those allow scientists to conclude trends about larger population, examine relationships between variables within a sample taken from the data and make generalisations or predictions about how those variables relate to a larger population.
This method does not take each individual piece of data into account and usually a representative sample is taken called a statistical sample. From the analysis scientists are able to conclude about the population that the sample came from.
Main limitations of traditional data analysis in context of large volumes of data such as big data come from the volume itself. As mentioned above volume is a problem in terms of storage technology which traditional methods are not well suited for.
Also going back to relational database management systems it is not feasible to store such vast amounts of data.
Three of the 5Vs of big data are good examples of limitations of traditional data alalisys on comparison to new technologies. Those are: Volume, Velocity and Variety that are defined above. All of those 3Vs present a great challenge in context of traditional data analysis while are more efficiently managed by new approaches and technologies such as Hodoop or Machine Learning.
In previous section we have covered characteristics of big data itself that came in form of 5Vs. In this section we will have a look at characteristics of big data analisis.
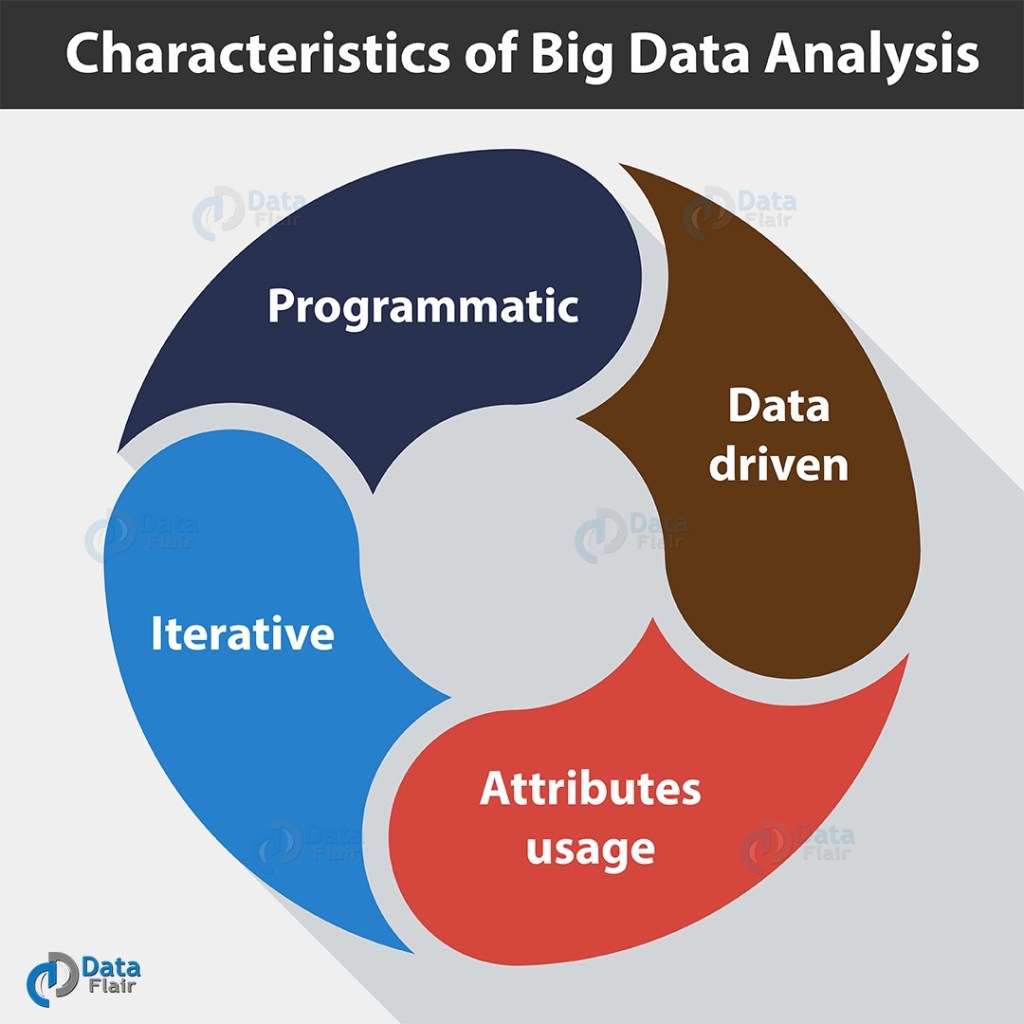
There are 4 main characteristics of big data analysis:
- Programmatic
In most cases analysing big data involves custom software or procedures that may need to be programmed even when using open source software to operate on big data custom extensions may need to be added for particular needs of data analisis.
- Data Driven
Having huge data sets enables a data driven analysis. As opposed to hypothesis-driven approach where scientist would develop a premise and collect data to whenever that premise is correct. Machine learning algorithms allow to do this kind of analysis hypothesis-free.
- Attributes usage
In the past analysts may have been dealing with 100s of attributes or characteristics of data source. With big data there may be gigabytes of those attributes or observations.
- Iterative
Modern advancements in computing power makes iteration easier and faster. Models can be trained on larger chunks of data as well as can be iterated as many times as it is required for analysts to be satisfied with the results. This was also enabled by distributed computing networks and by leveraging cloud computing as service. This in turn made those resources readily available and more cost effective even for smaller companies as well as individuals.
- Visualisation
Visualisation can be thought of as another characteristic of big data and currently it is a most challenging aspect that data scientist face.
Enormous amounts of data, event in a processed and analysed state is often not very useful insight for a human being. It may not be easily comprehended and actioned on.
While traditional graphs did a good job for traditional data analysis in the past with big data there are simple too many data points (billions) to plot which usually fails due to in-memory limitations and poor scalability.
Solutions to those problems are constantly being developed. Some include the use of data clustering, tree maps, parallel coordinates or circular network diagrams.
Value of data:
Value is one of the characteristics of big data. there is a great value to be found form the big data analysis which currently including understanding of customers, targeting, optimising business processes.
Big data combined with machine learning has a huge value now and it will only grow in the future. Currently machine learning helps to regulate traffic more efficiently as well as saves huge amounts of money in medical industry by cutting the time required to make diagnosis.
Currently value of big data is on the raise and for the right reasons. Having enough data and incorporating machine-learning technologies to analyse that data leads to even more accurate predictions.
Main and most cited benefit that comes from big data analysis making better strategic decisions.
Companies can improved their operational processes, reduced costs, or improve customer insights and/or experience.
With new technologies and computing power growth the value of future data is on the raise because of the near-future possibility to tap into the amounts of data that is not currently possible.
To give an example, current value of Facebook is around £263 billion while their revenue for the year 2017 was $40 billion. The future value of data.
References:
Luhn HP. “A Business Intelligence System”. IBM Journal of Research and Development. October 1958. Vol.2-4. p.314-319
Marr, B. (2015). Why only one of the 5 Vs of big data really matters. [online] IBM Big Data & Analytics Hub. Available at: https://www.ibmbigdatahub.com/blog/why-only-one-5-vs-big-data-really-matters [Accessed 27 Mar. 2019].
Cleveland WS. “Data Science: an Action Plan for Expanding the Technical Areas of the Field of Statistics”. International Statistical Review. April 2001. Vol.69-1. P.21-26. DOI: http://dx.doi.org/10.2307/1403527
Page L, Brin S, Motwani R. “The PageRank Citation Ranking: Bringing Order to the Web”. Technical Report. January 1998. Stanford Digital Library Technologies Project
Dean J, Ghemawat S. “MapReduce: Simplified Data Processing on Large Clusters”. Proceedings of the 6th Symposium on Operating System Design and Implementation (OSDI’04). December 2004. p.137-150
Niño, Mikel & Illarramendi, Arantza. (2015). Understanding Big Data: antecedents, origin and later development. Dyna New Technologies. 2. 1-8. 10.6036/NT7835.
